
Projects that track themselves
A project is an inspection round on a layer: it moves from draft to active to completed on its own and shows its pace while it runs.
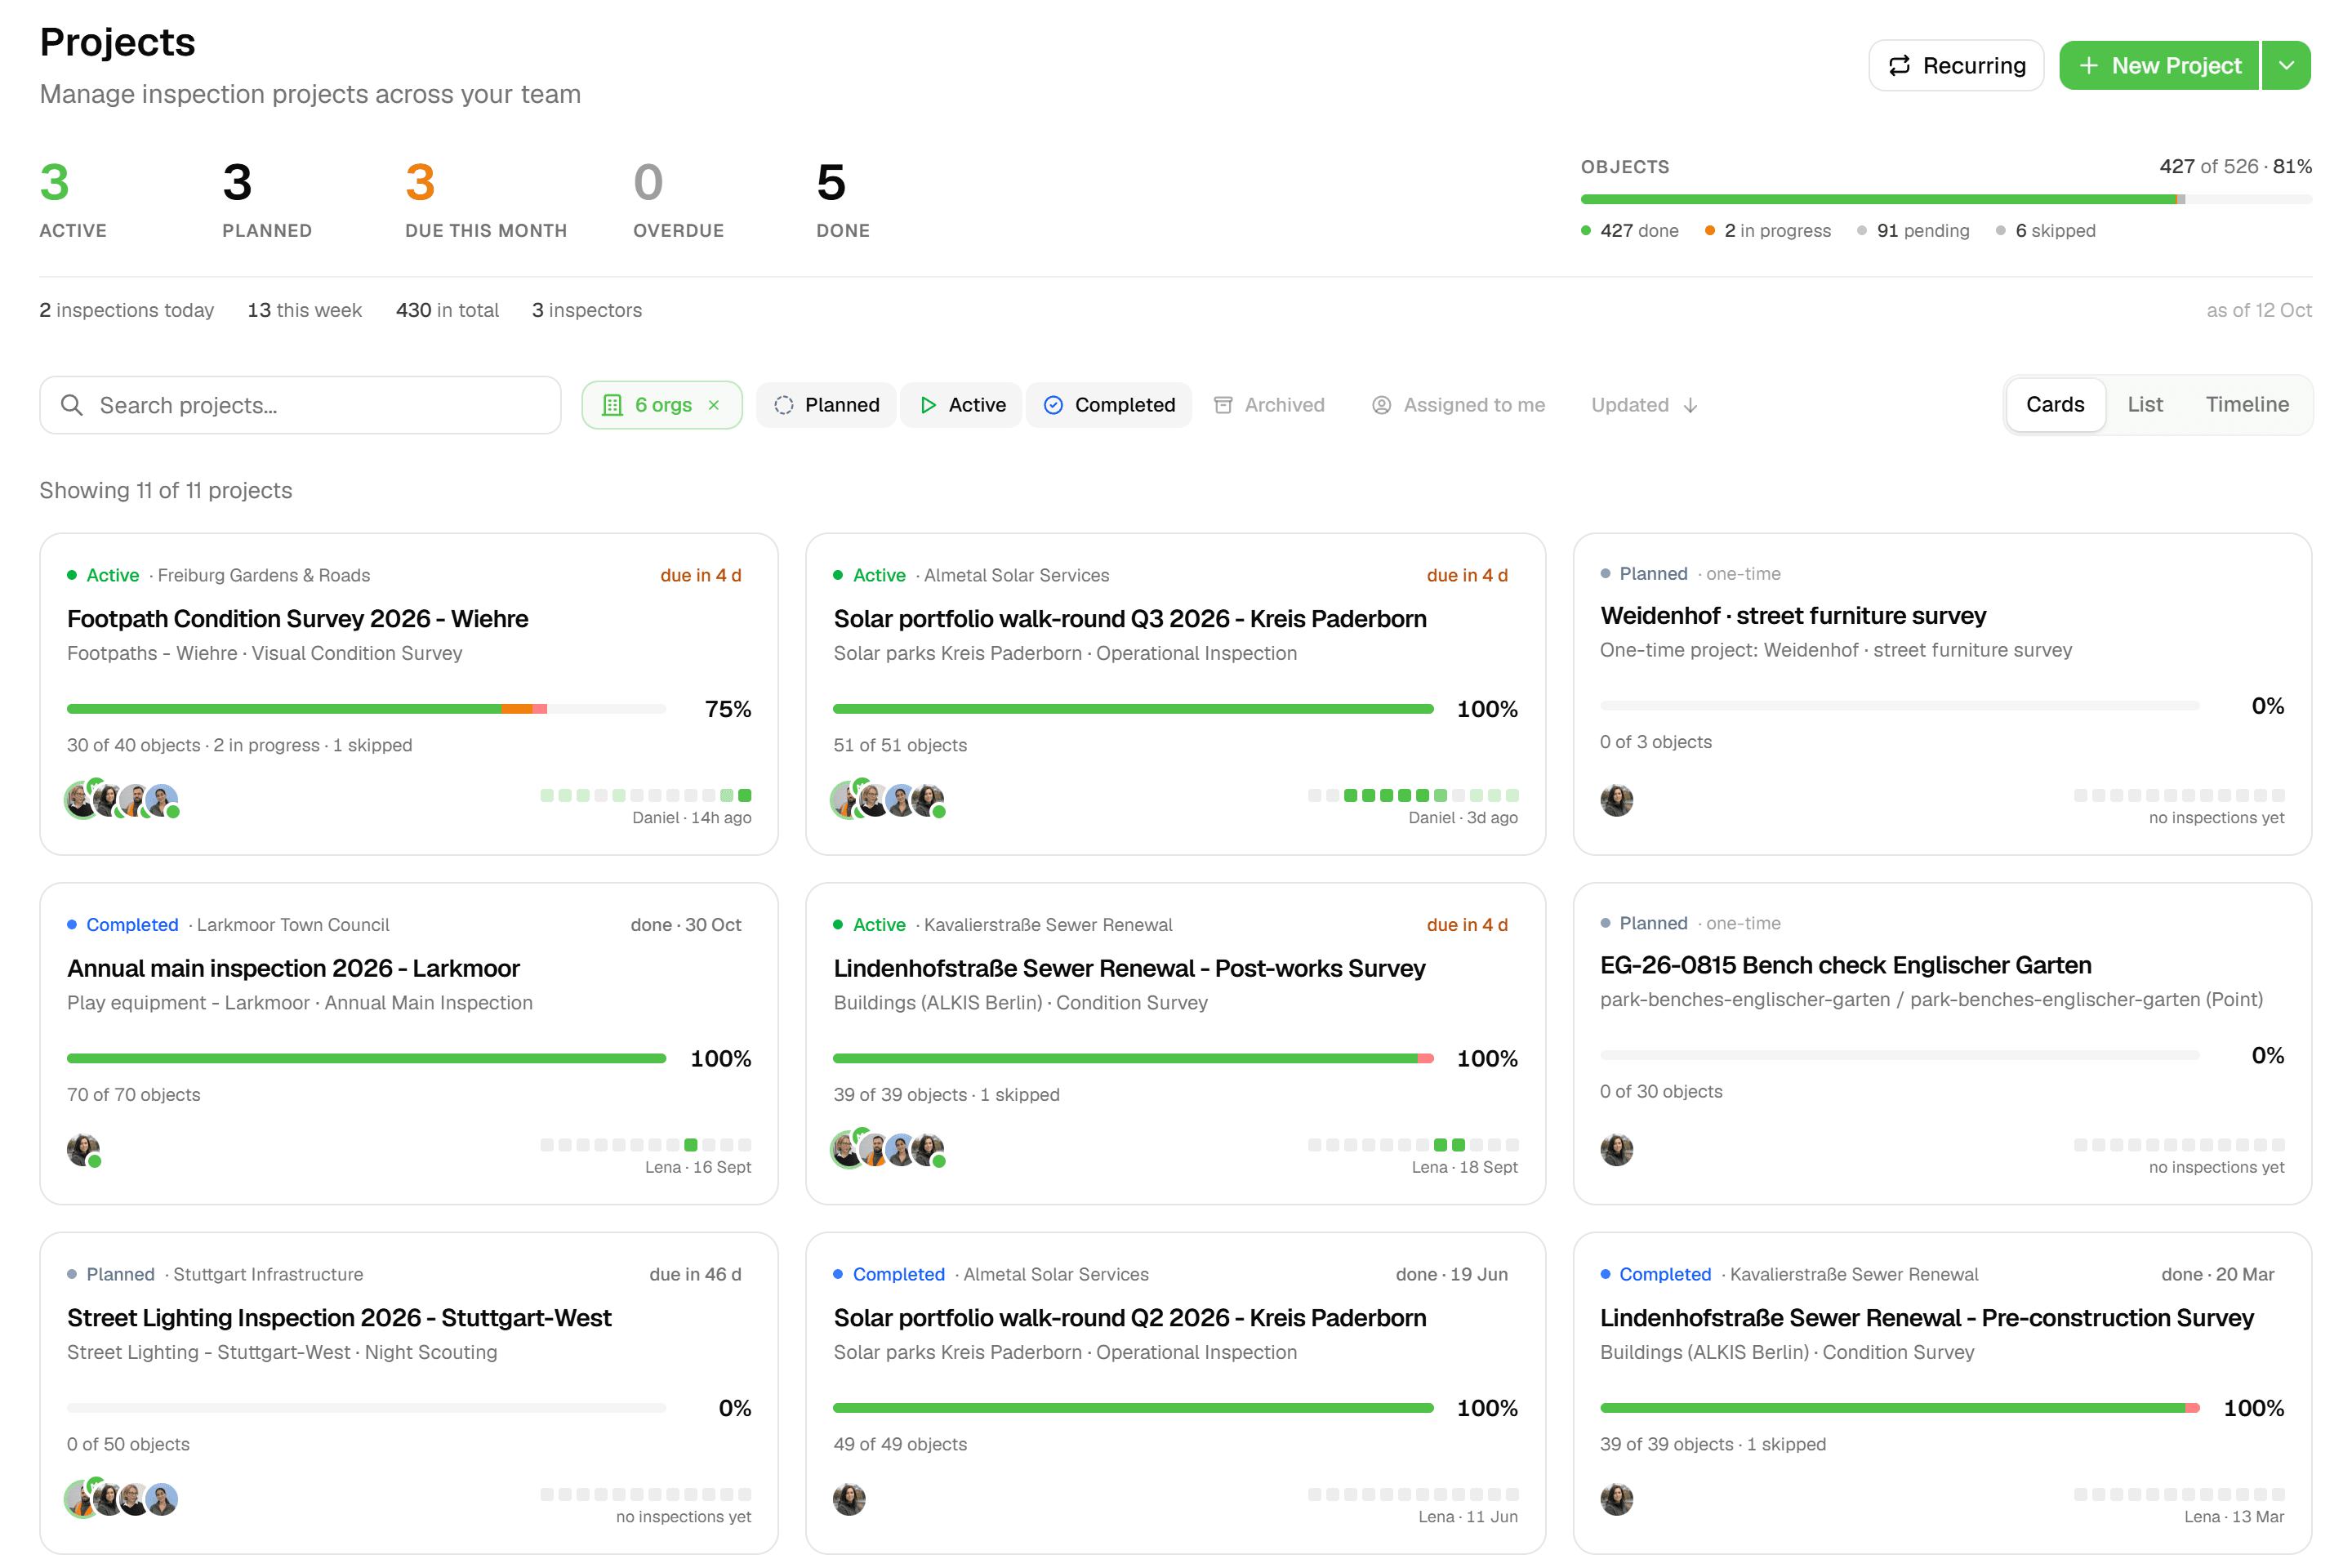
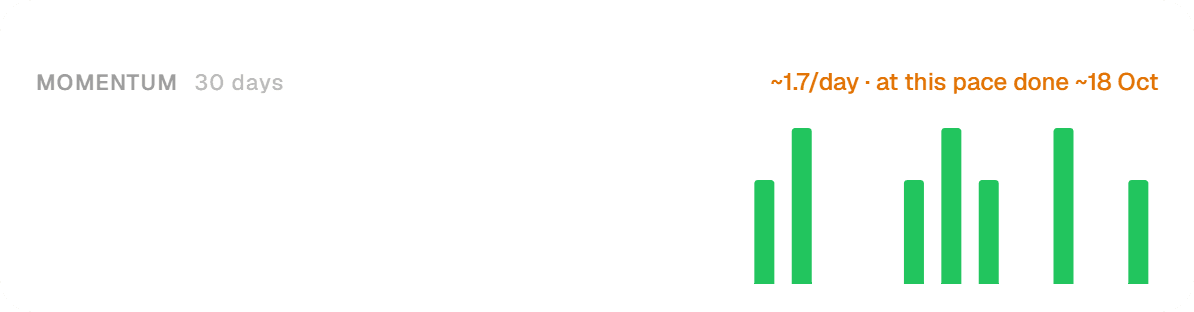
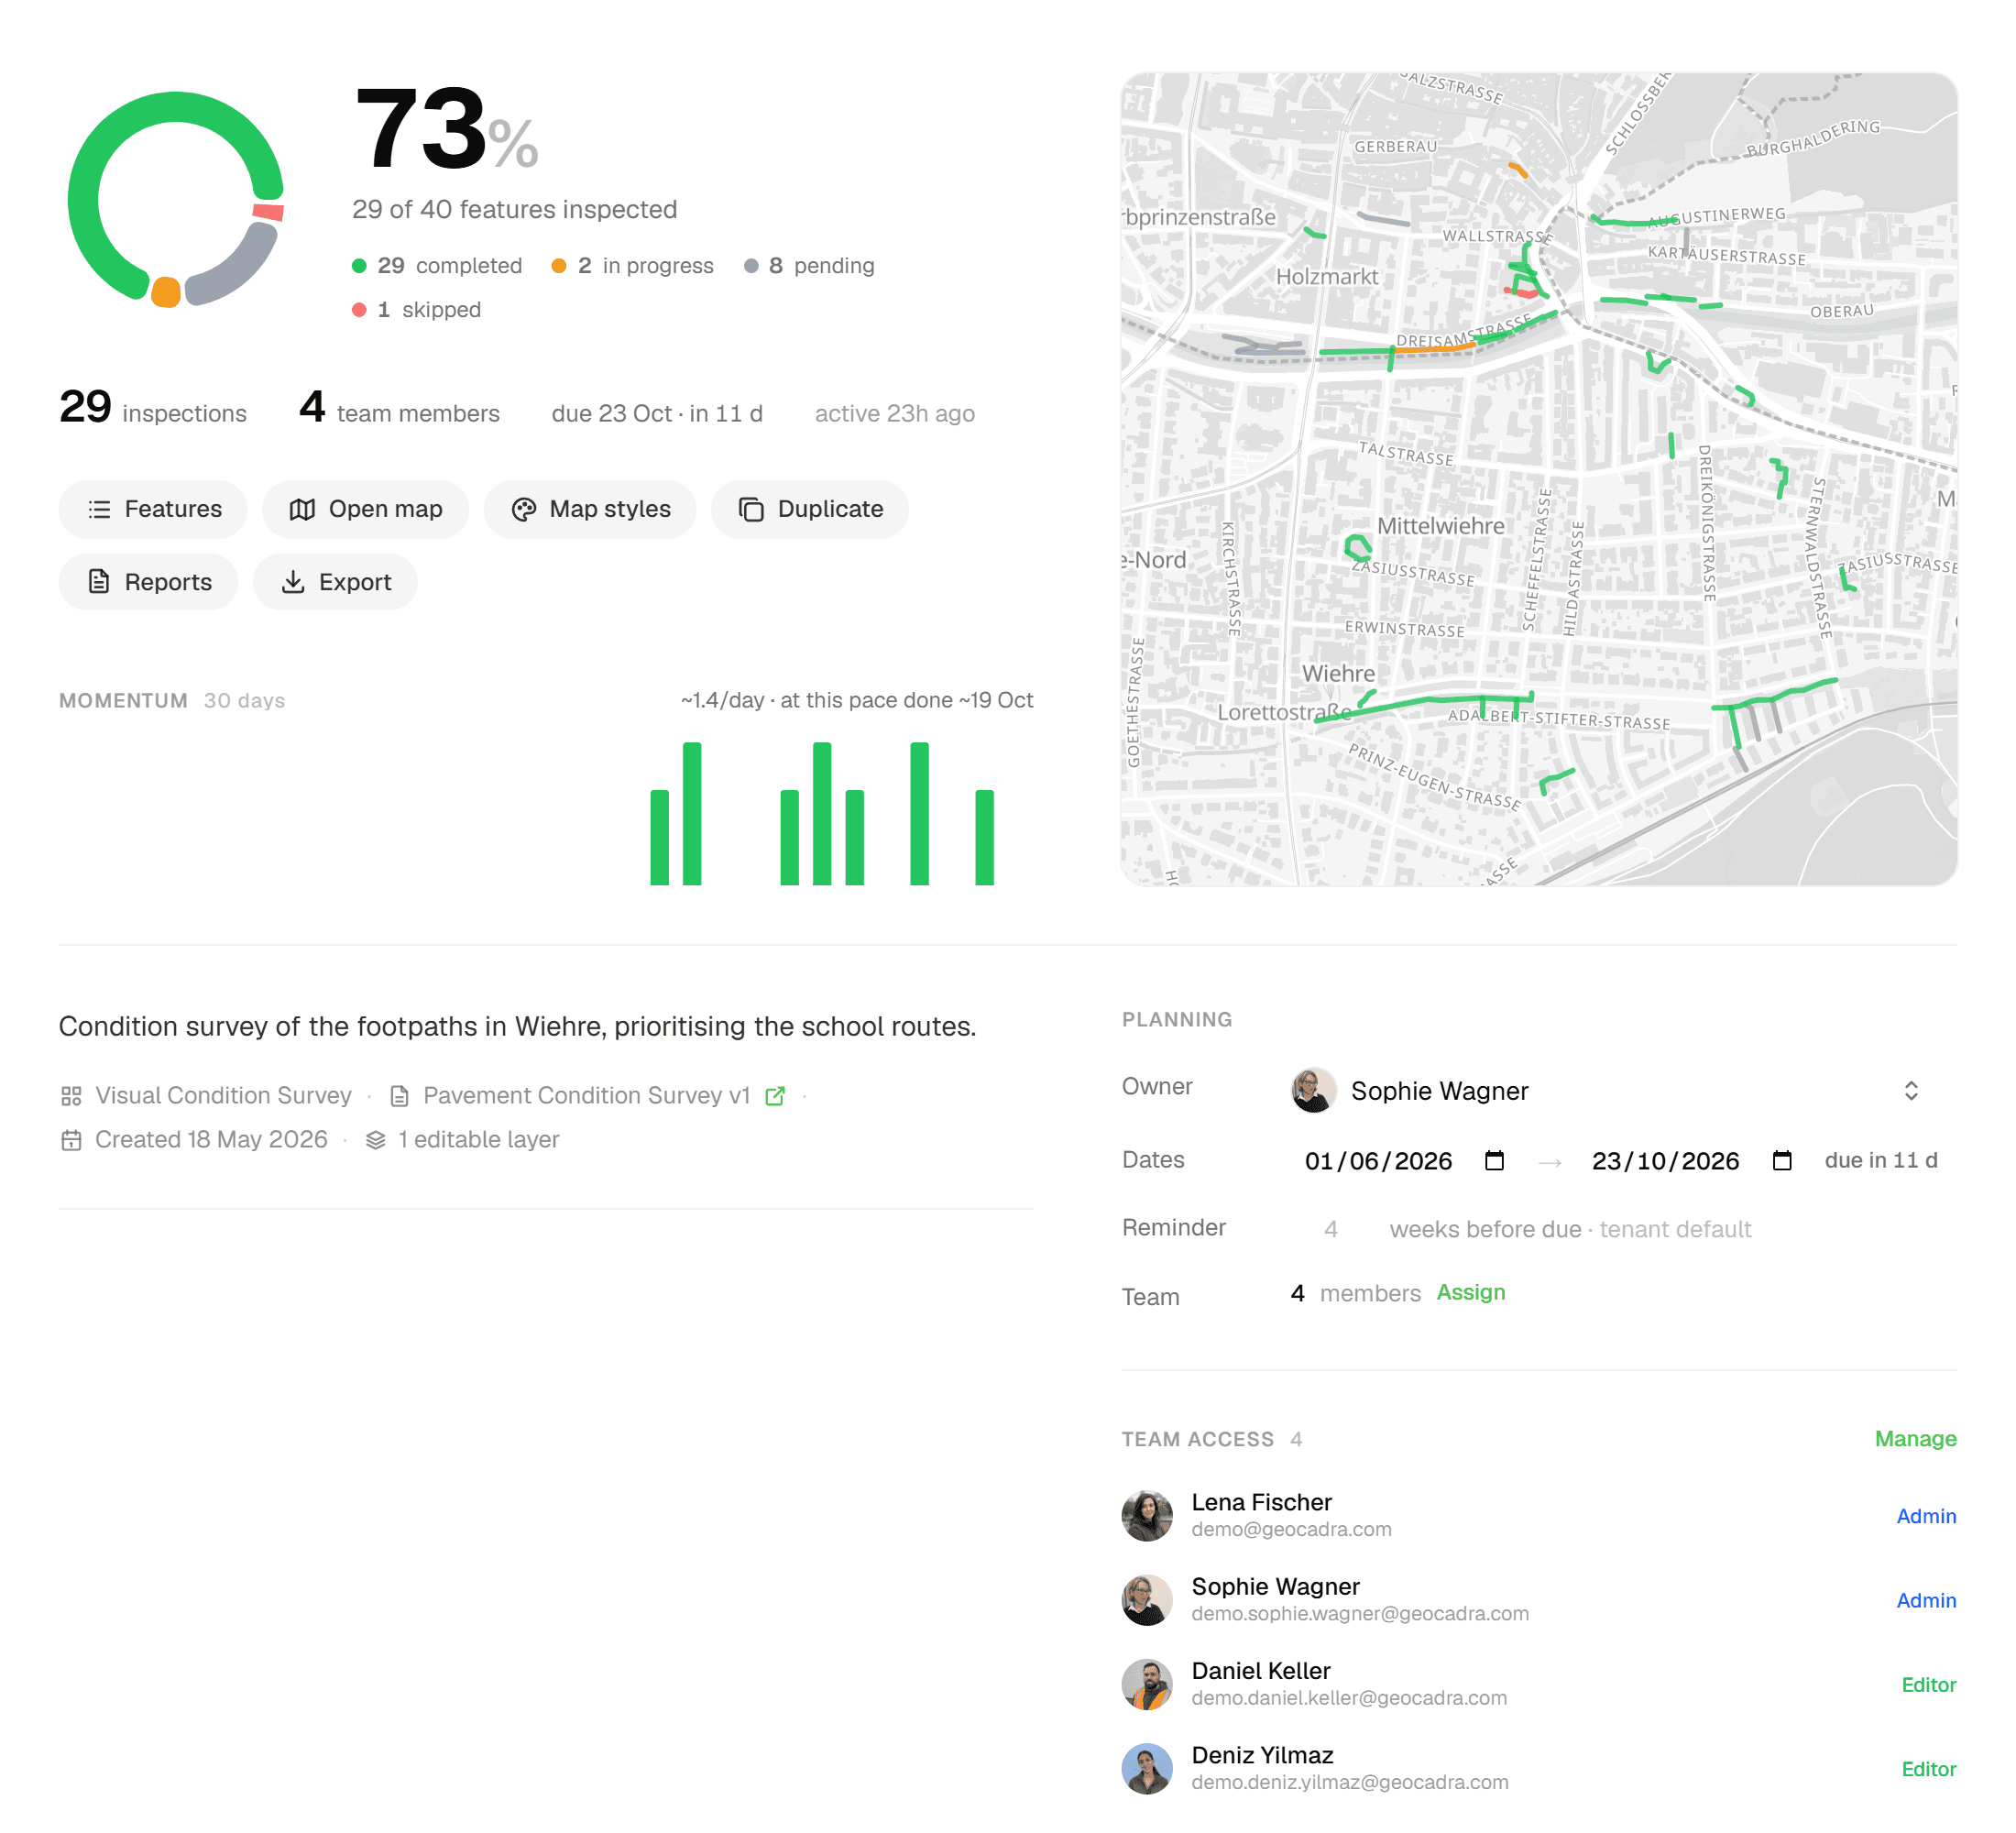
Create a project, bind an inspection form to each layer and start inspecting. The Overview tab keeps score: progress percentage, status breakdown, a 30-day momentum chart and a projected completion date based on the last seven days. Reports and exports live on the same project, so the deliverable is never far from the data.
The problem
Status tracked on a whiteboard
An inspection round with a few hundred features and a deadline tends to be tracked next to the data rather than in it: a spreadsheet of done and not done, a weekly count, a guess at whether the team will finish in time. By the time the guess turns out to be wrong, the options are gone.
The solution
The project keeps score for you
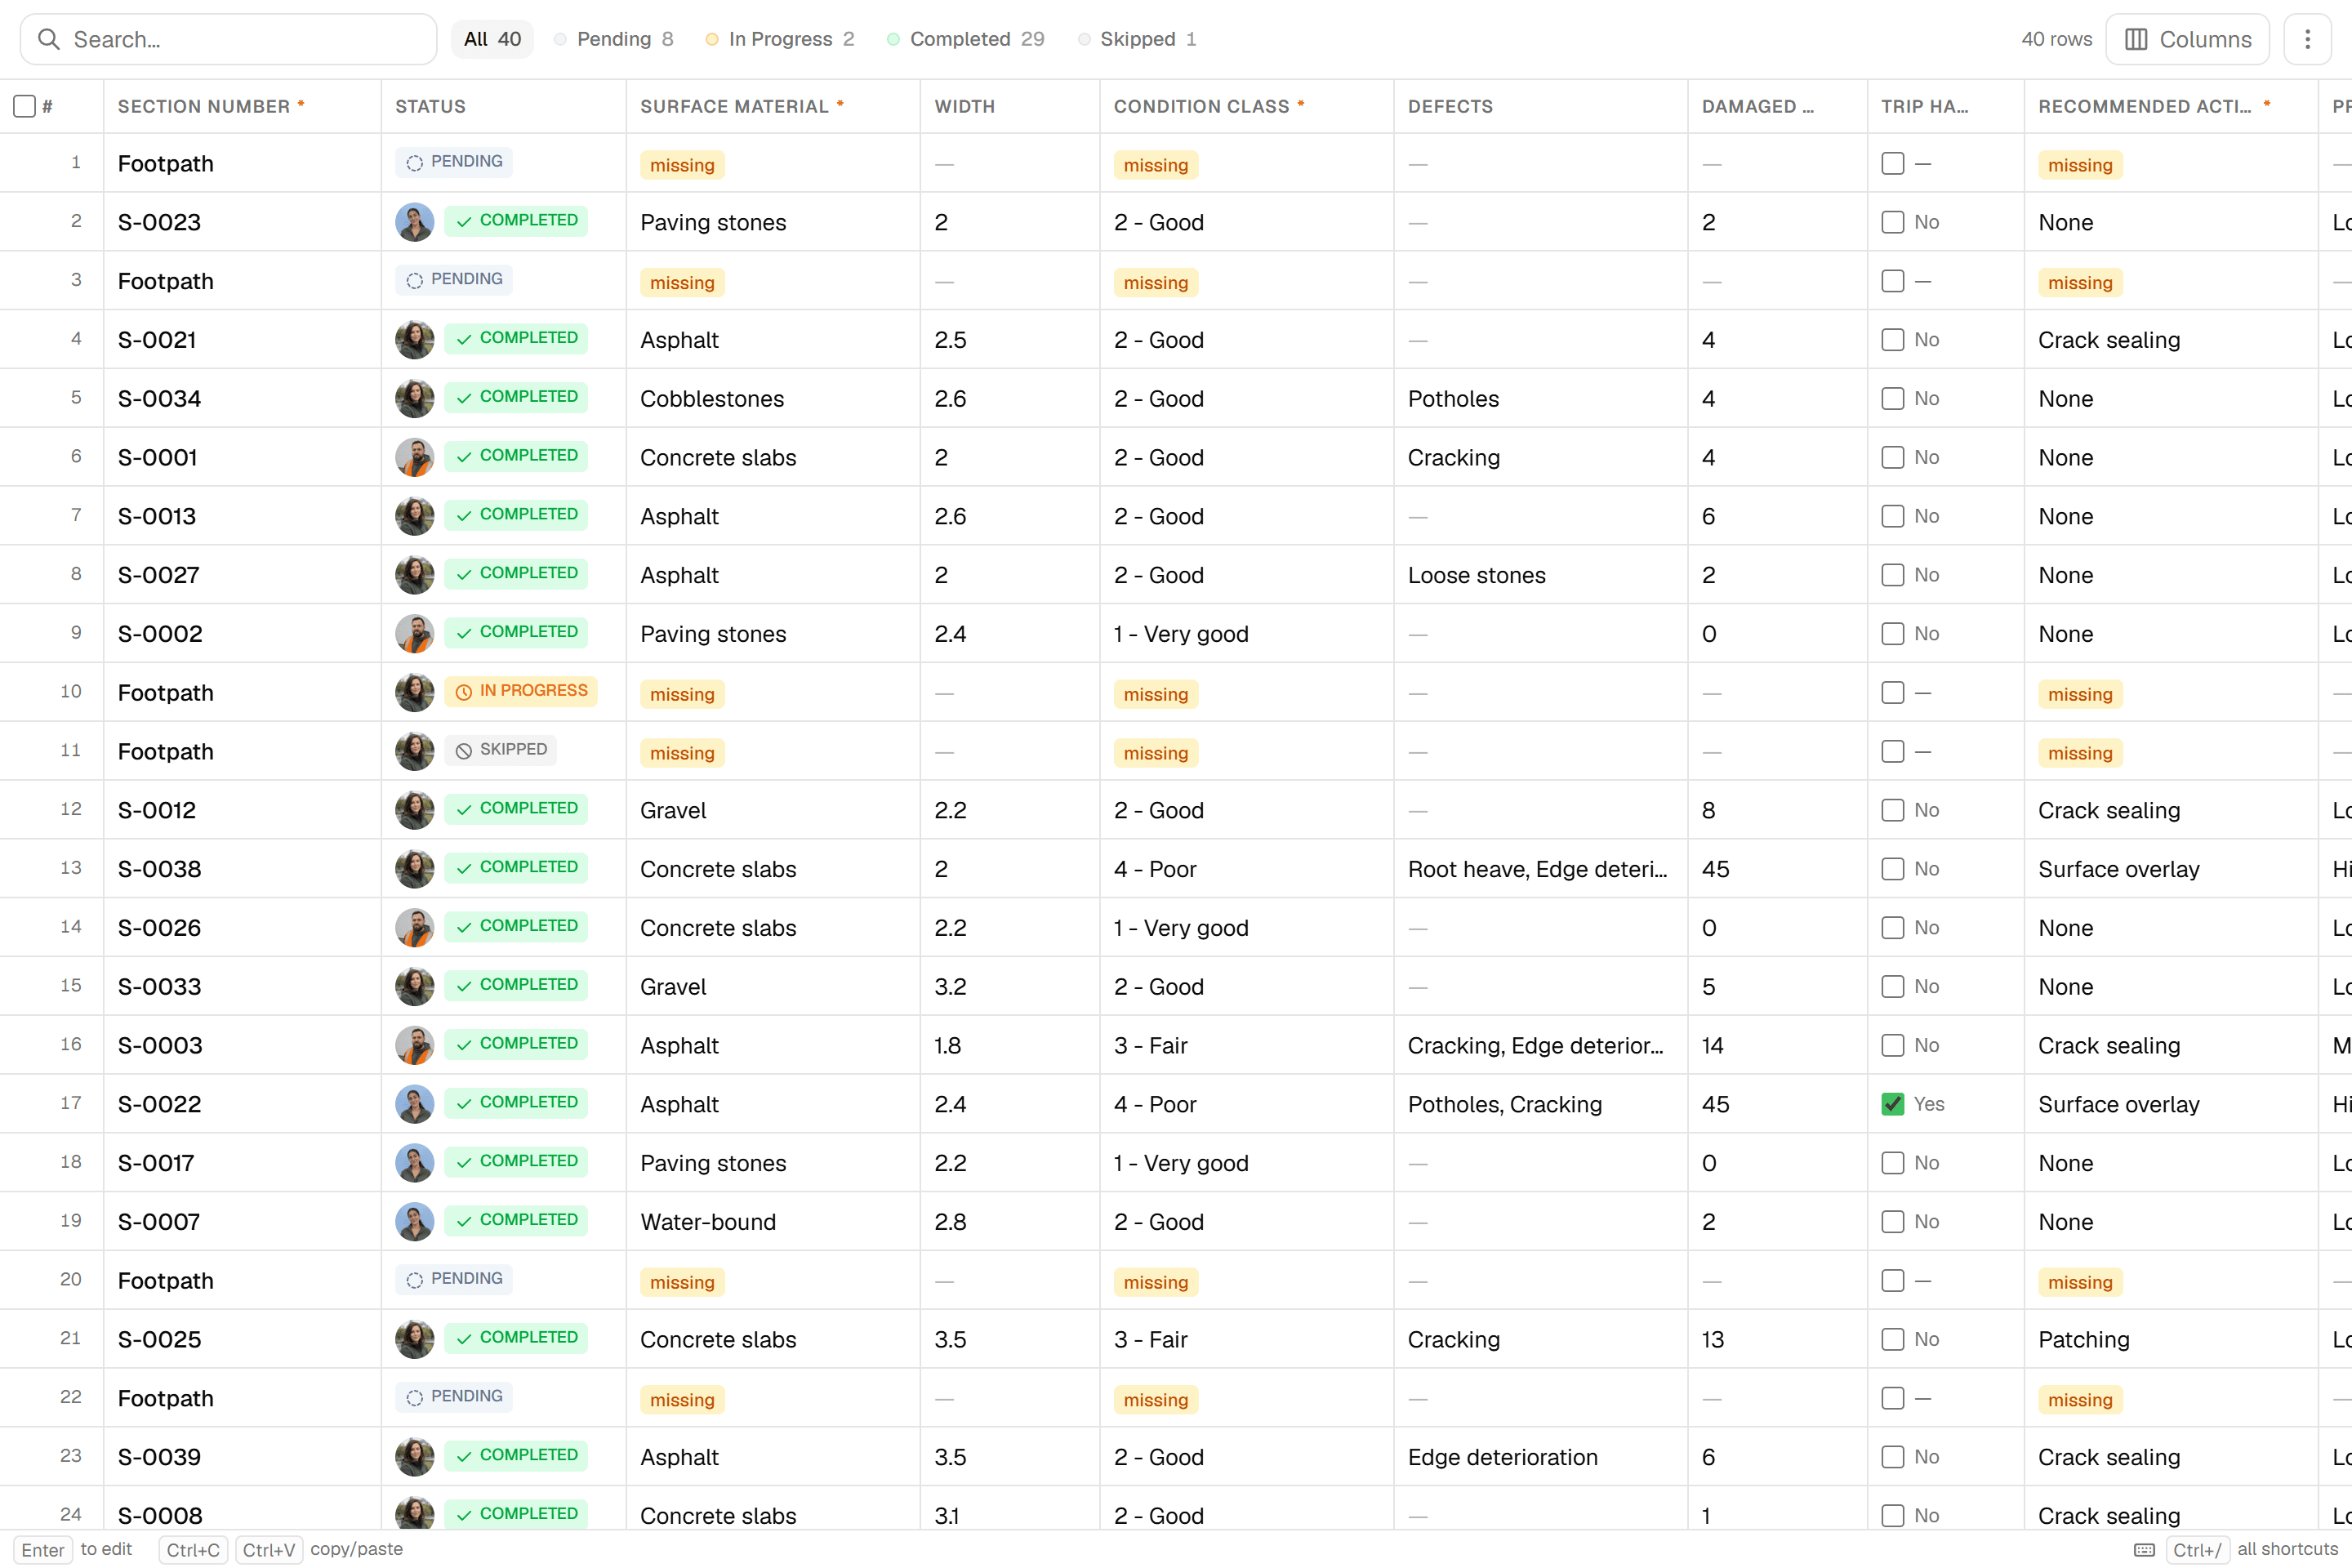
Every feature in a project has a status: Pending, In Progress, Completed or Skipped. Completed is only earned by submitting an inspection, so a Completed count always stands for a real submission. The project itself switches from draft to active on the first change and to completed once every feature is completed or skipped, and the Overview tab turns the submissions into a progress percentage, a status breakdown and a pace line: '~12/day · at this pace done ~28 Nov', shown in amber when that date lands past the due date.
Key benefits
- Status moves itself: draft → active → completed
- Progress %, status breakdown and a 30-day momentum chart
- Pace line: '~12/day · at this pace done ~28 Nov'
- One inspection form per layer
- Project roles: Admin, Editor, Viewer
- Reports and Exports hubs on every project
How It Works
- 01
Say where the data comes from
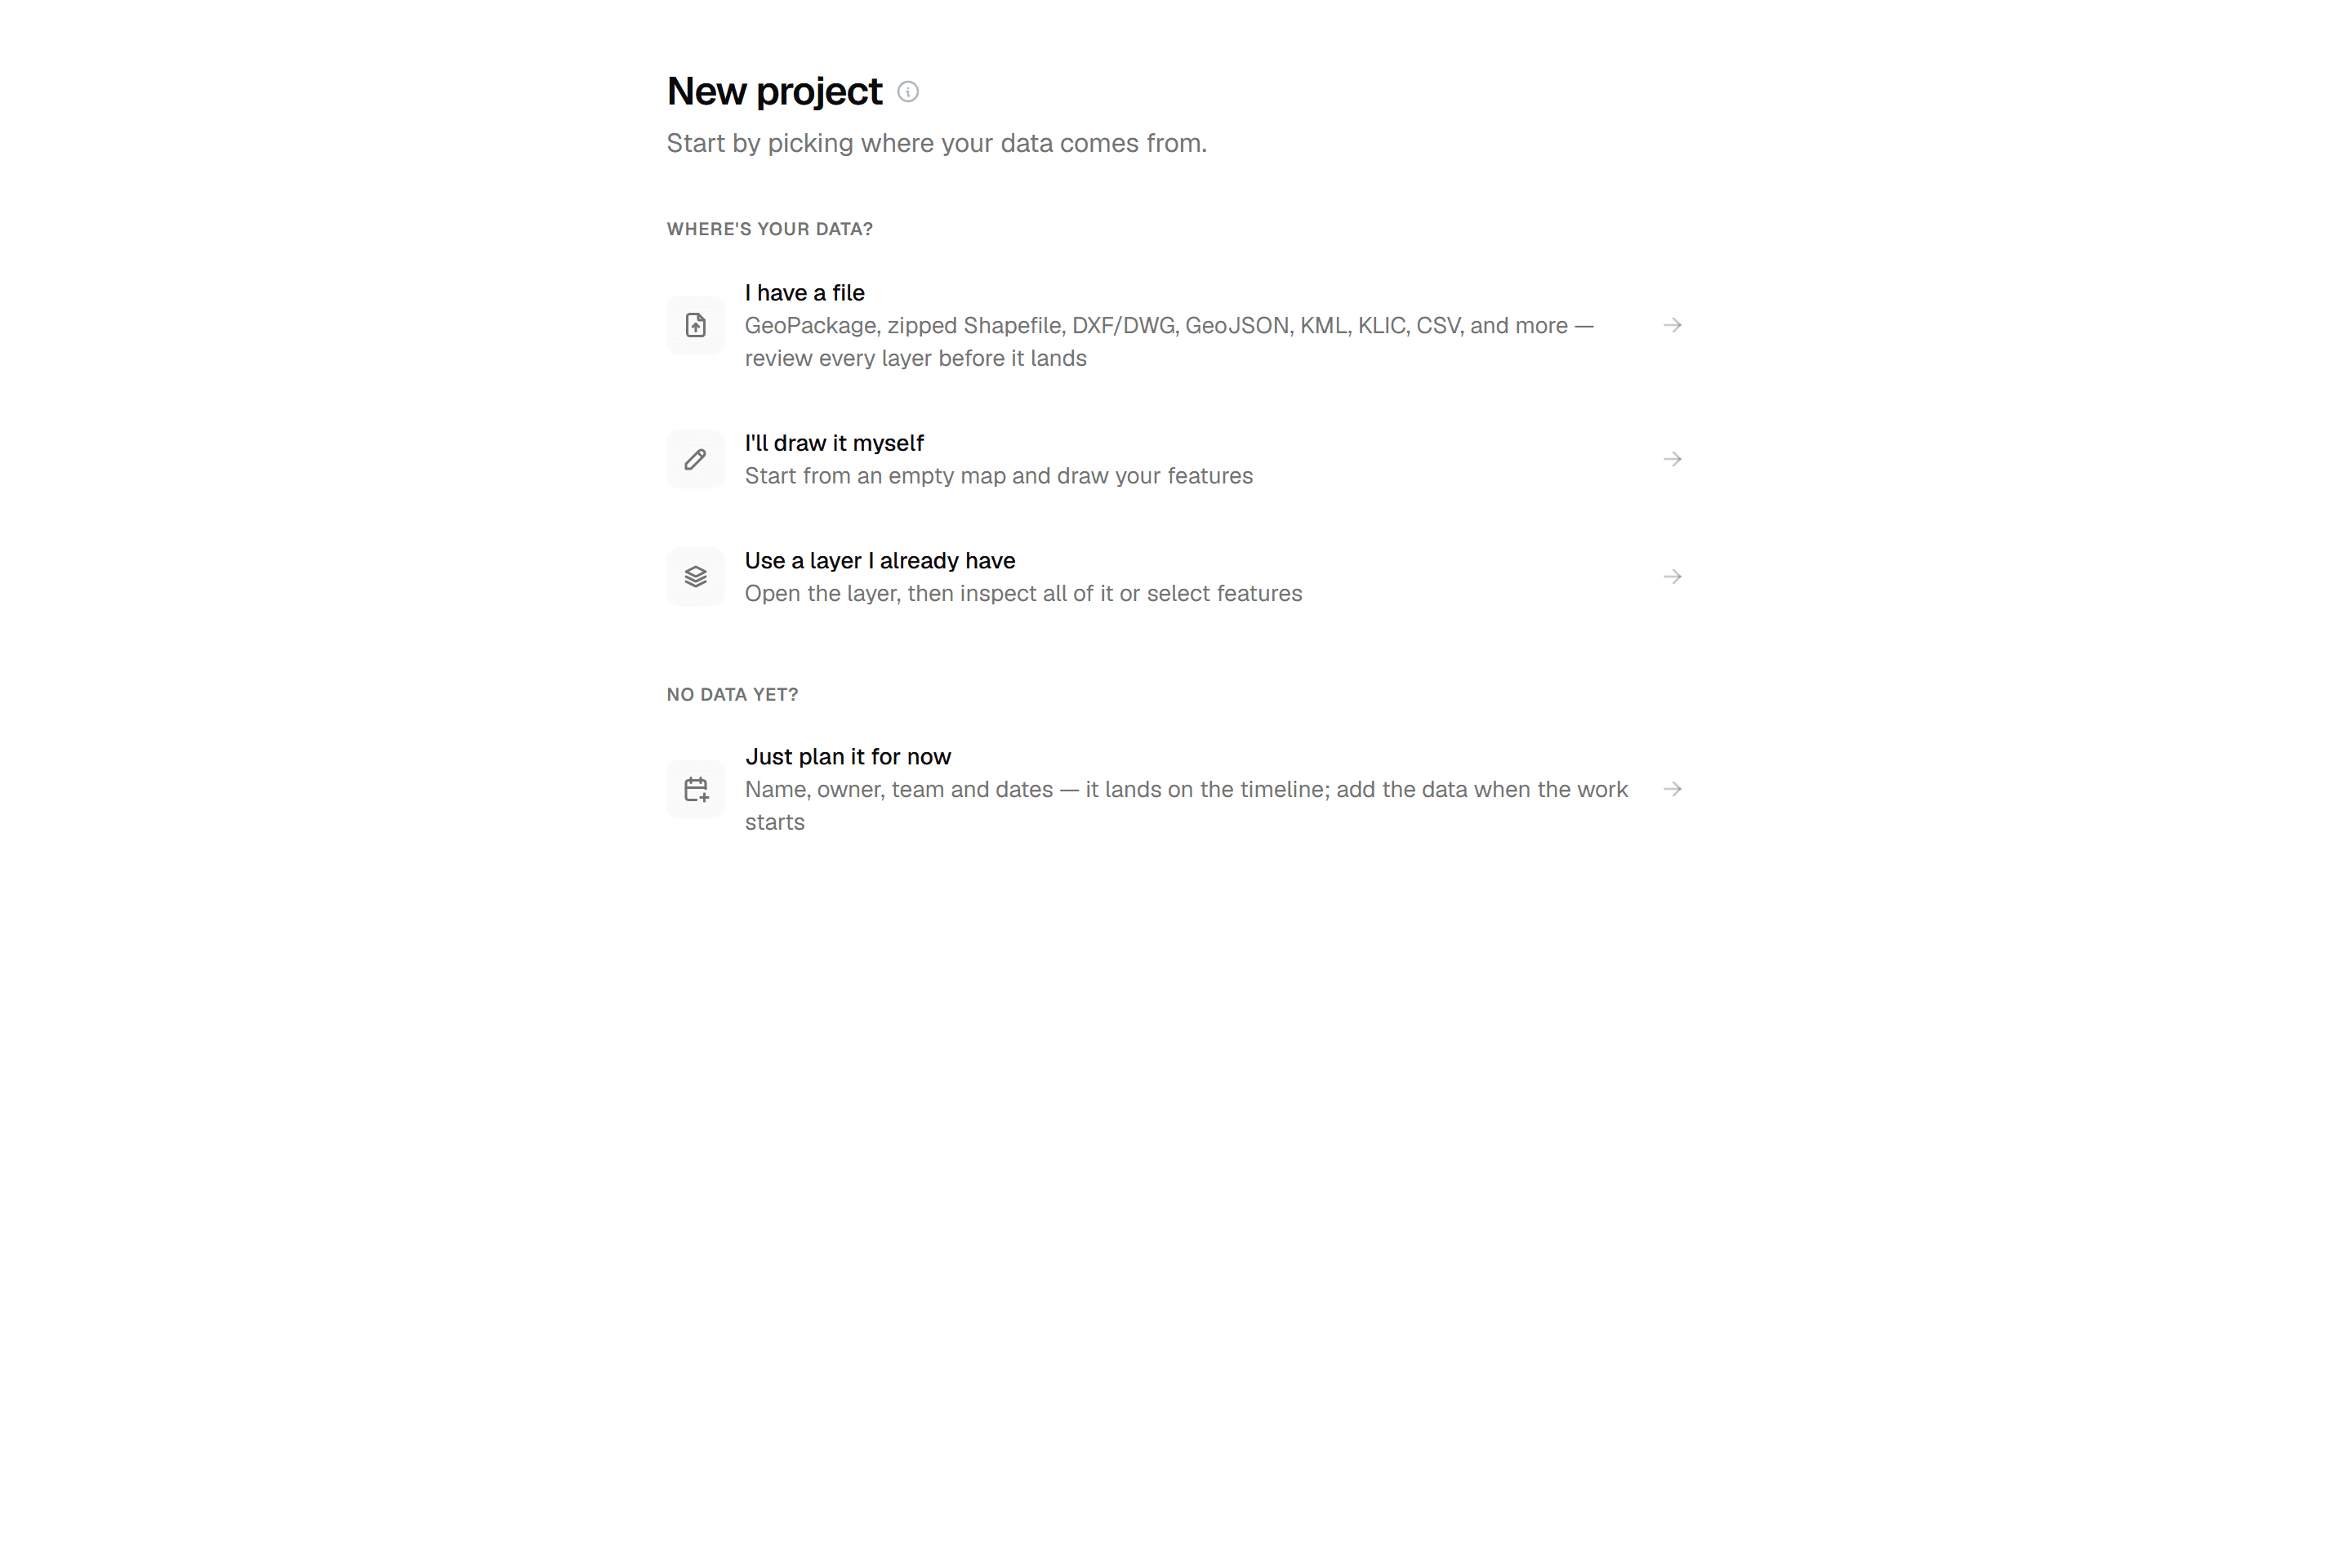
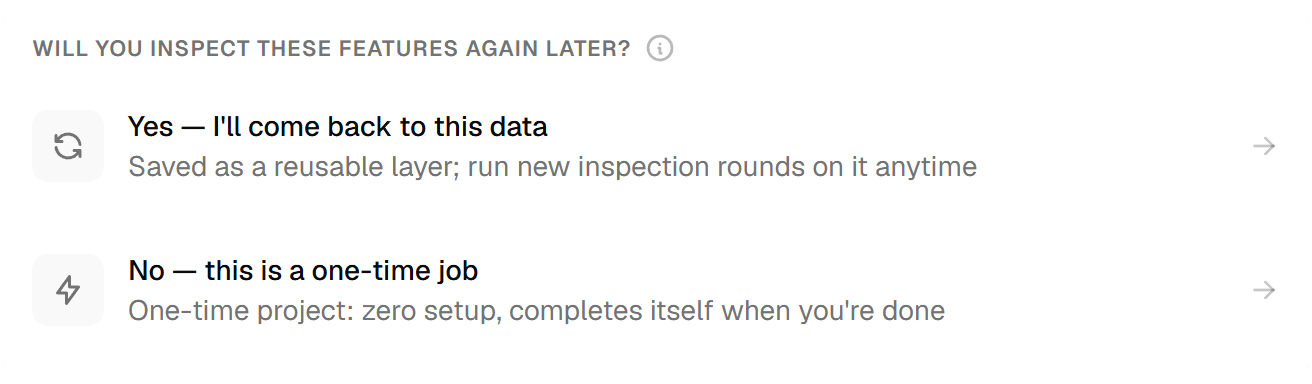
The new-project chooser asks 'Where's your data?': 'I have a file', 'I'll draw it myself' or 'Use a layer I already have'. Admins are then asked 'Will you inspect these features again later?'. Answer yes and the data is saved as a reusable layer that the project runs on; answer no and you get a One-time project.
- 02
Let the Overview keep score
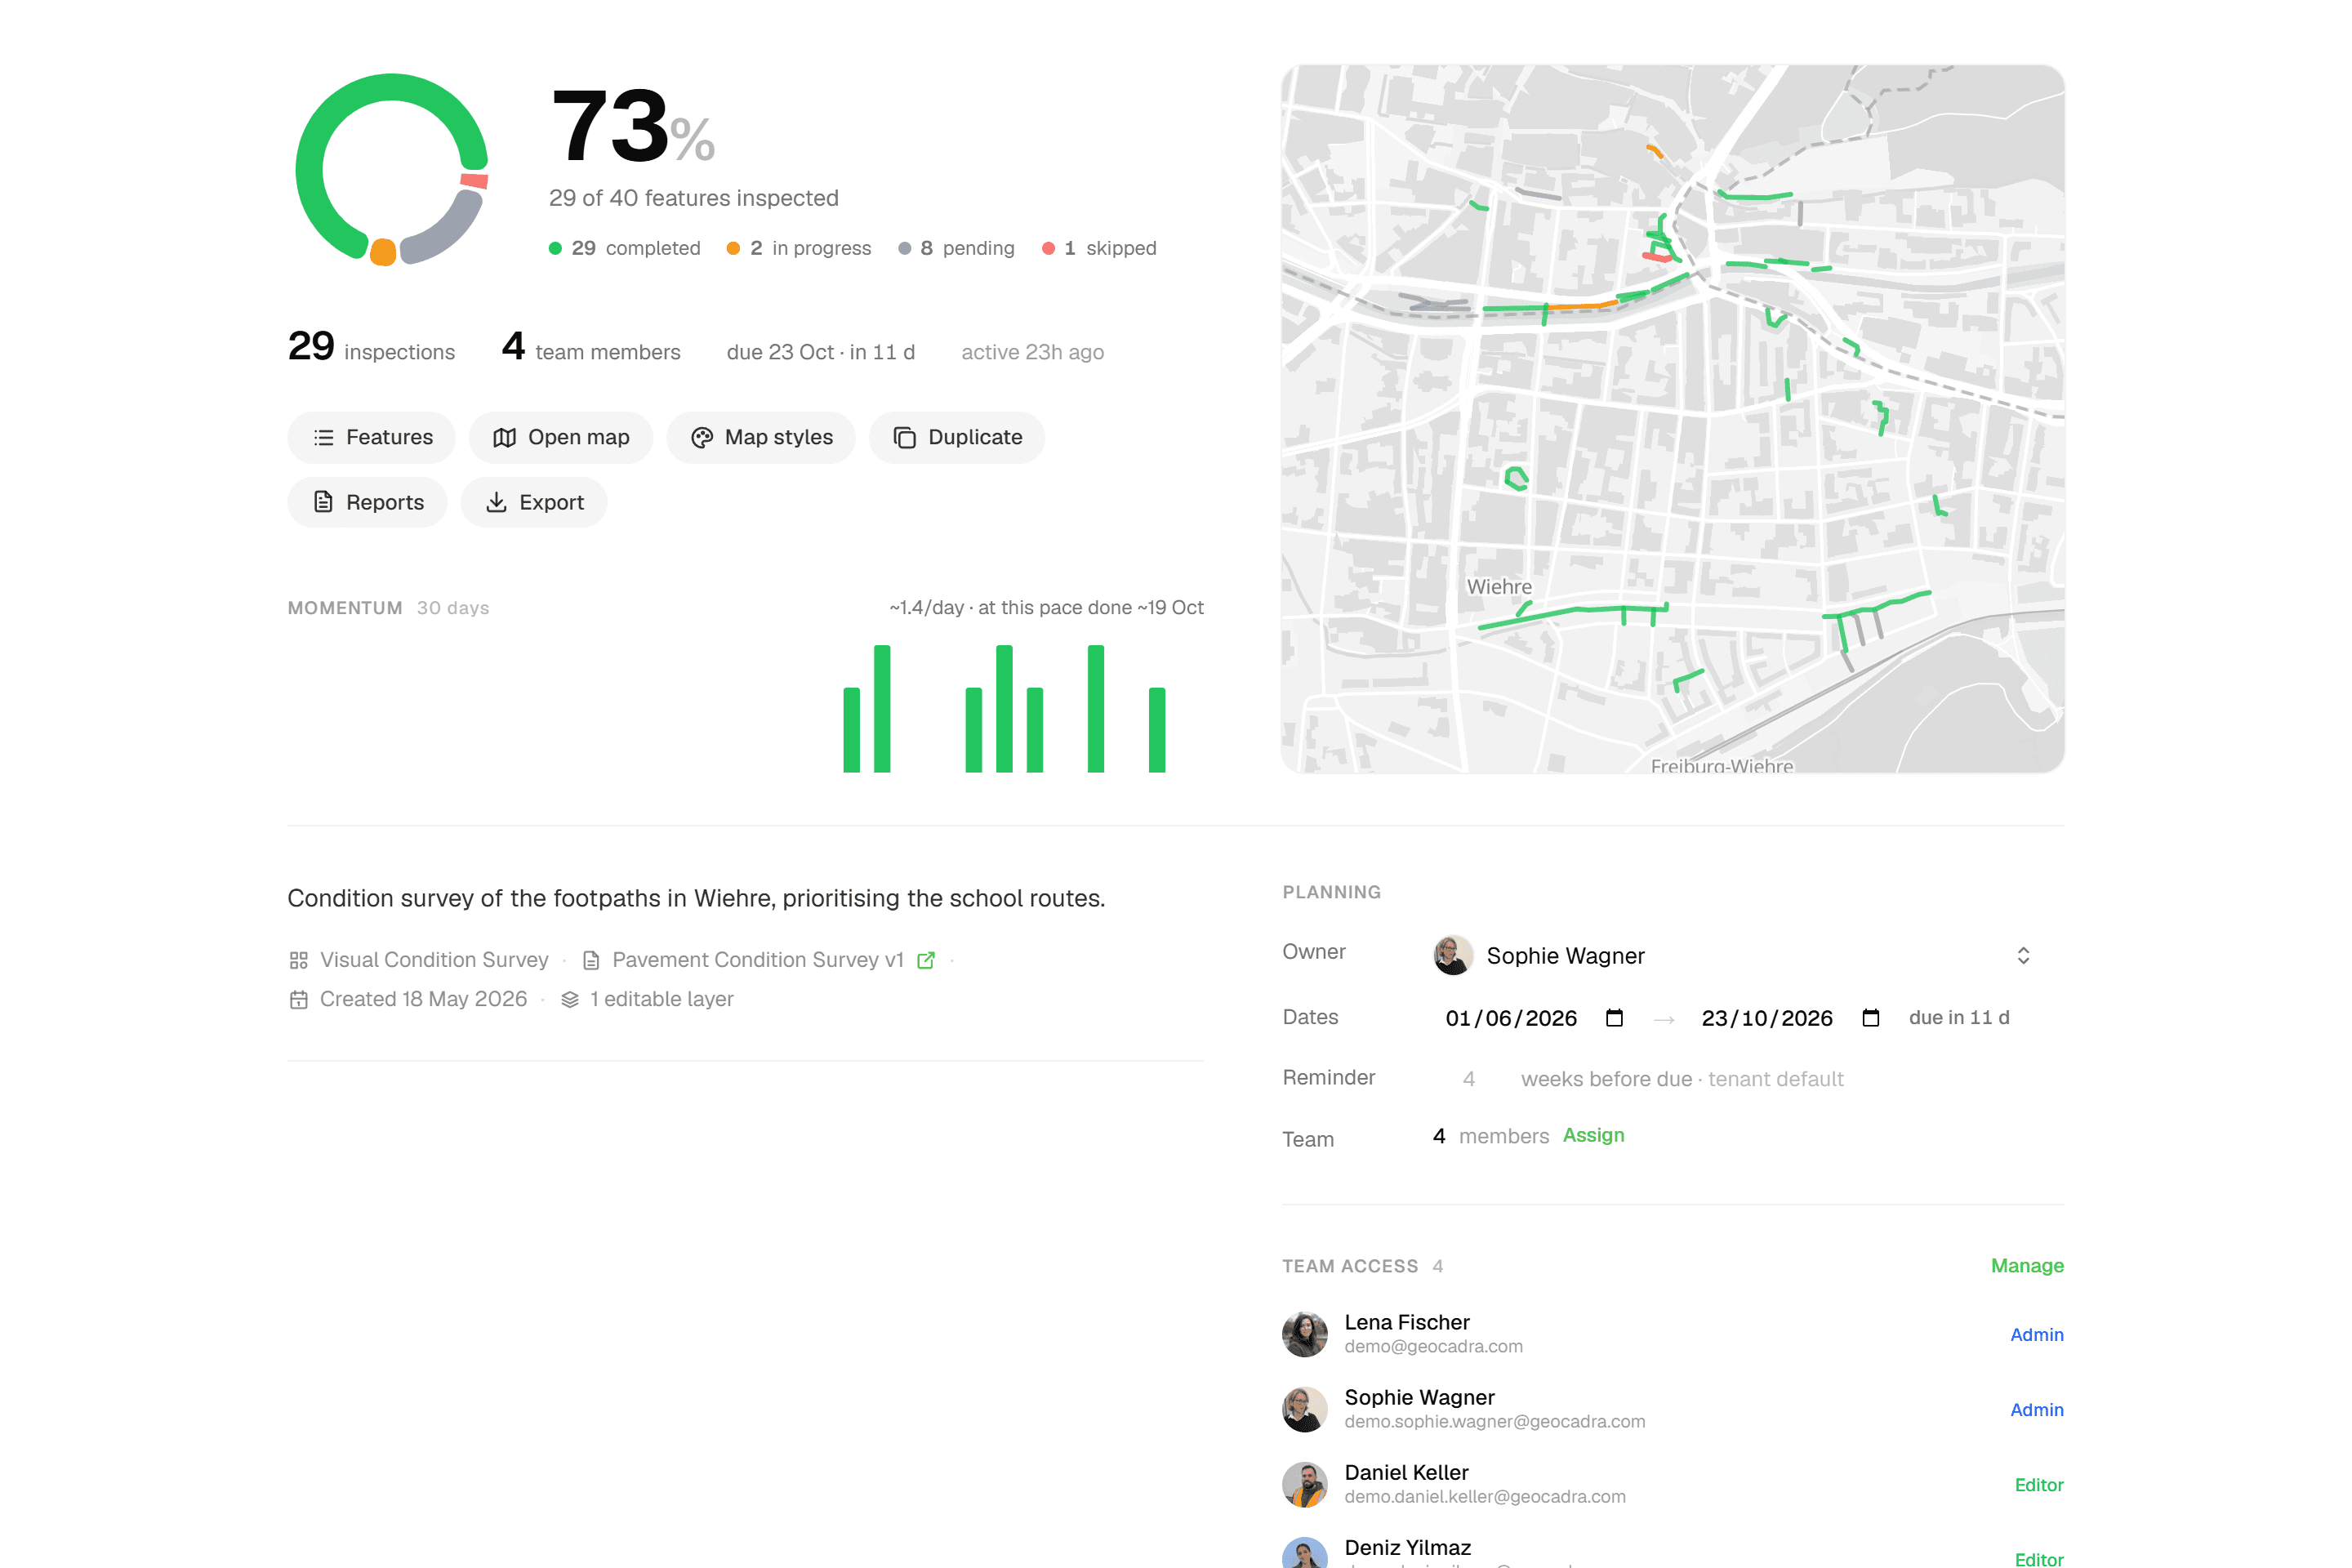
The Overview tab shows a progress percentage, a status breakdown (Completed / In Progress / Pending / Skipped), inspections per day as a 30-day momentum chart and a pace line with a projected completion date; 'due 28 Nov · 9d left' counts down to the expected end date. A setup checklist walks through Create a layer → Assign inspection forms → Add features → Import reference material → Add project context.
- 03
Work in the grid or on the map
The Features tab is an Excel-like grid per layer; the Map tab is where you select features and inspect them, one by one or with 'Apply Same to All' for up to 100 at once. Reports and Exports have their own hubs, reached from chips on the Overview.

Common Use Cases
- 01
Recurring rounds on a layer you keep
Layers hold map data you keep; projects are inspection rounds on that layer. Run this year's round as a new project and the layer's features carry every previous submission with them.
- 02
One-off jobs
For a job whose data you will not reuse, answer no when the chooser asks whether you'll inspect the features again. The project is created the moment the import commits and lives in a dedicated 'One-time projects' organization; active one-time projects are capped at 5 on Starter, 20 on Pro and unlimited on Business and up.
- 03
Rounds with a deadline
Set an expected end date and the Overview shows 'due 28 Nov · 9d left' or overdue. The pace line projects a completion date from the trailing seven days and turns amber when it lands past the due date, so you see the slip while there is still time to act.
- 04
A client who wants to watch
Add a client contact to the project as Viewer ('View-only access'). They see the overview, the map and the data and can download exports and report PDFs without being able to change anything; client contacts do not use a seat unless they are Admin, within your plan's free-viewer allowance of 2, 4 or 10 per purchased seat on Starter, Pro and Business.
Frequently Asked Questions
What is the difference between a layer, a project and a one-time project?
Layers hold map data you keep forever. Projects are inspection rounds on a layer, so one layer can have many projects over the years. One-time projects are one-off inspections whose data is not reusable afterwards; they live in a dedicated organization and have no Settings tab.
When does a project count as completed?
Automatically, once every feature is Completed or Skipped. The actual start date is recorded when the project goes active and the actual end date when it completes. Completed is only earned by submitting an inspection; Pending, In Progress and Skipped can be set by hand, and Skipped requires a reason.
How is the projected completion date calculated?
From the average number of inspections per day over the trailing seven days. The line reads '~12/day · at this pace done ~28 Nov' and is shown in amber when the date is beyond the project's expected end date.
Can layers in the same project use different forms?
Yes. Each project layer binds its own inspection form; the grid columns and the inspection sheet follow the form of the layer you are working in.
Who can see a project?
Project Settings > Team lists the 'Project Team' members with Admin ('Full project control'), Editor ('Can inspect and edit') or Viewer ('View-only access'), next to the access inherited from the workspace or the organization. Members with 'Assigned only' scope see just the organizations and projects they were added to.
Can I attach documents to a project?
Yes. The Files section on the Overview takes PDF, TXT, Markdown, JPEG and PNG files up to 50 MB each. They are plain project storage, and the report assistant can read them when writing a report.
Explore More Features
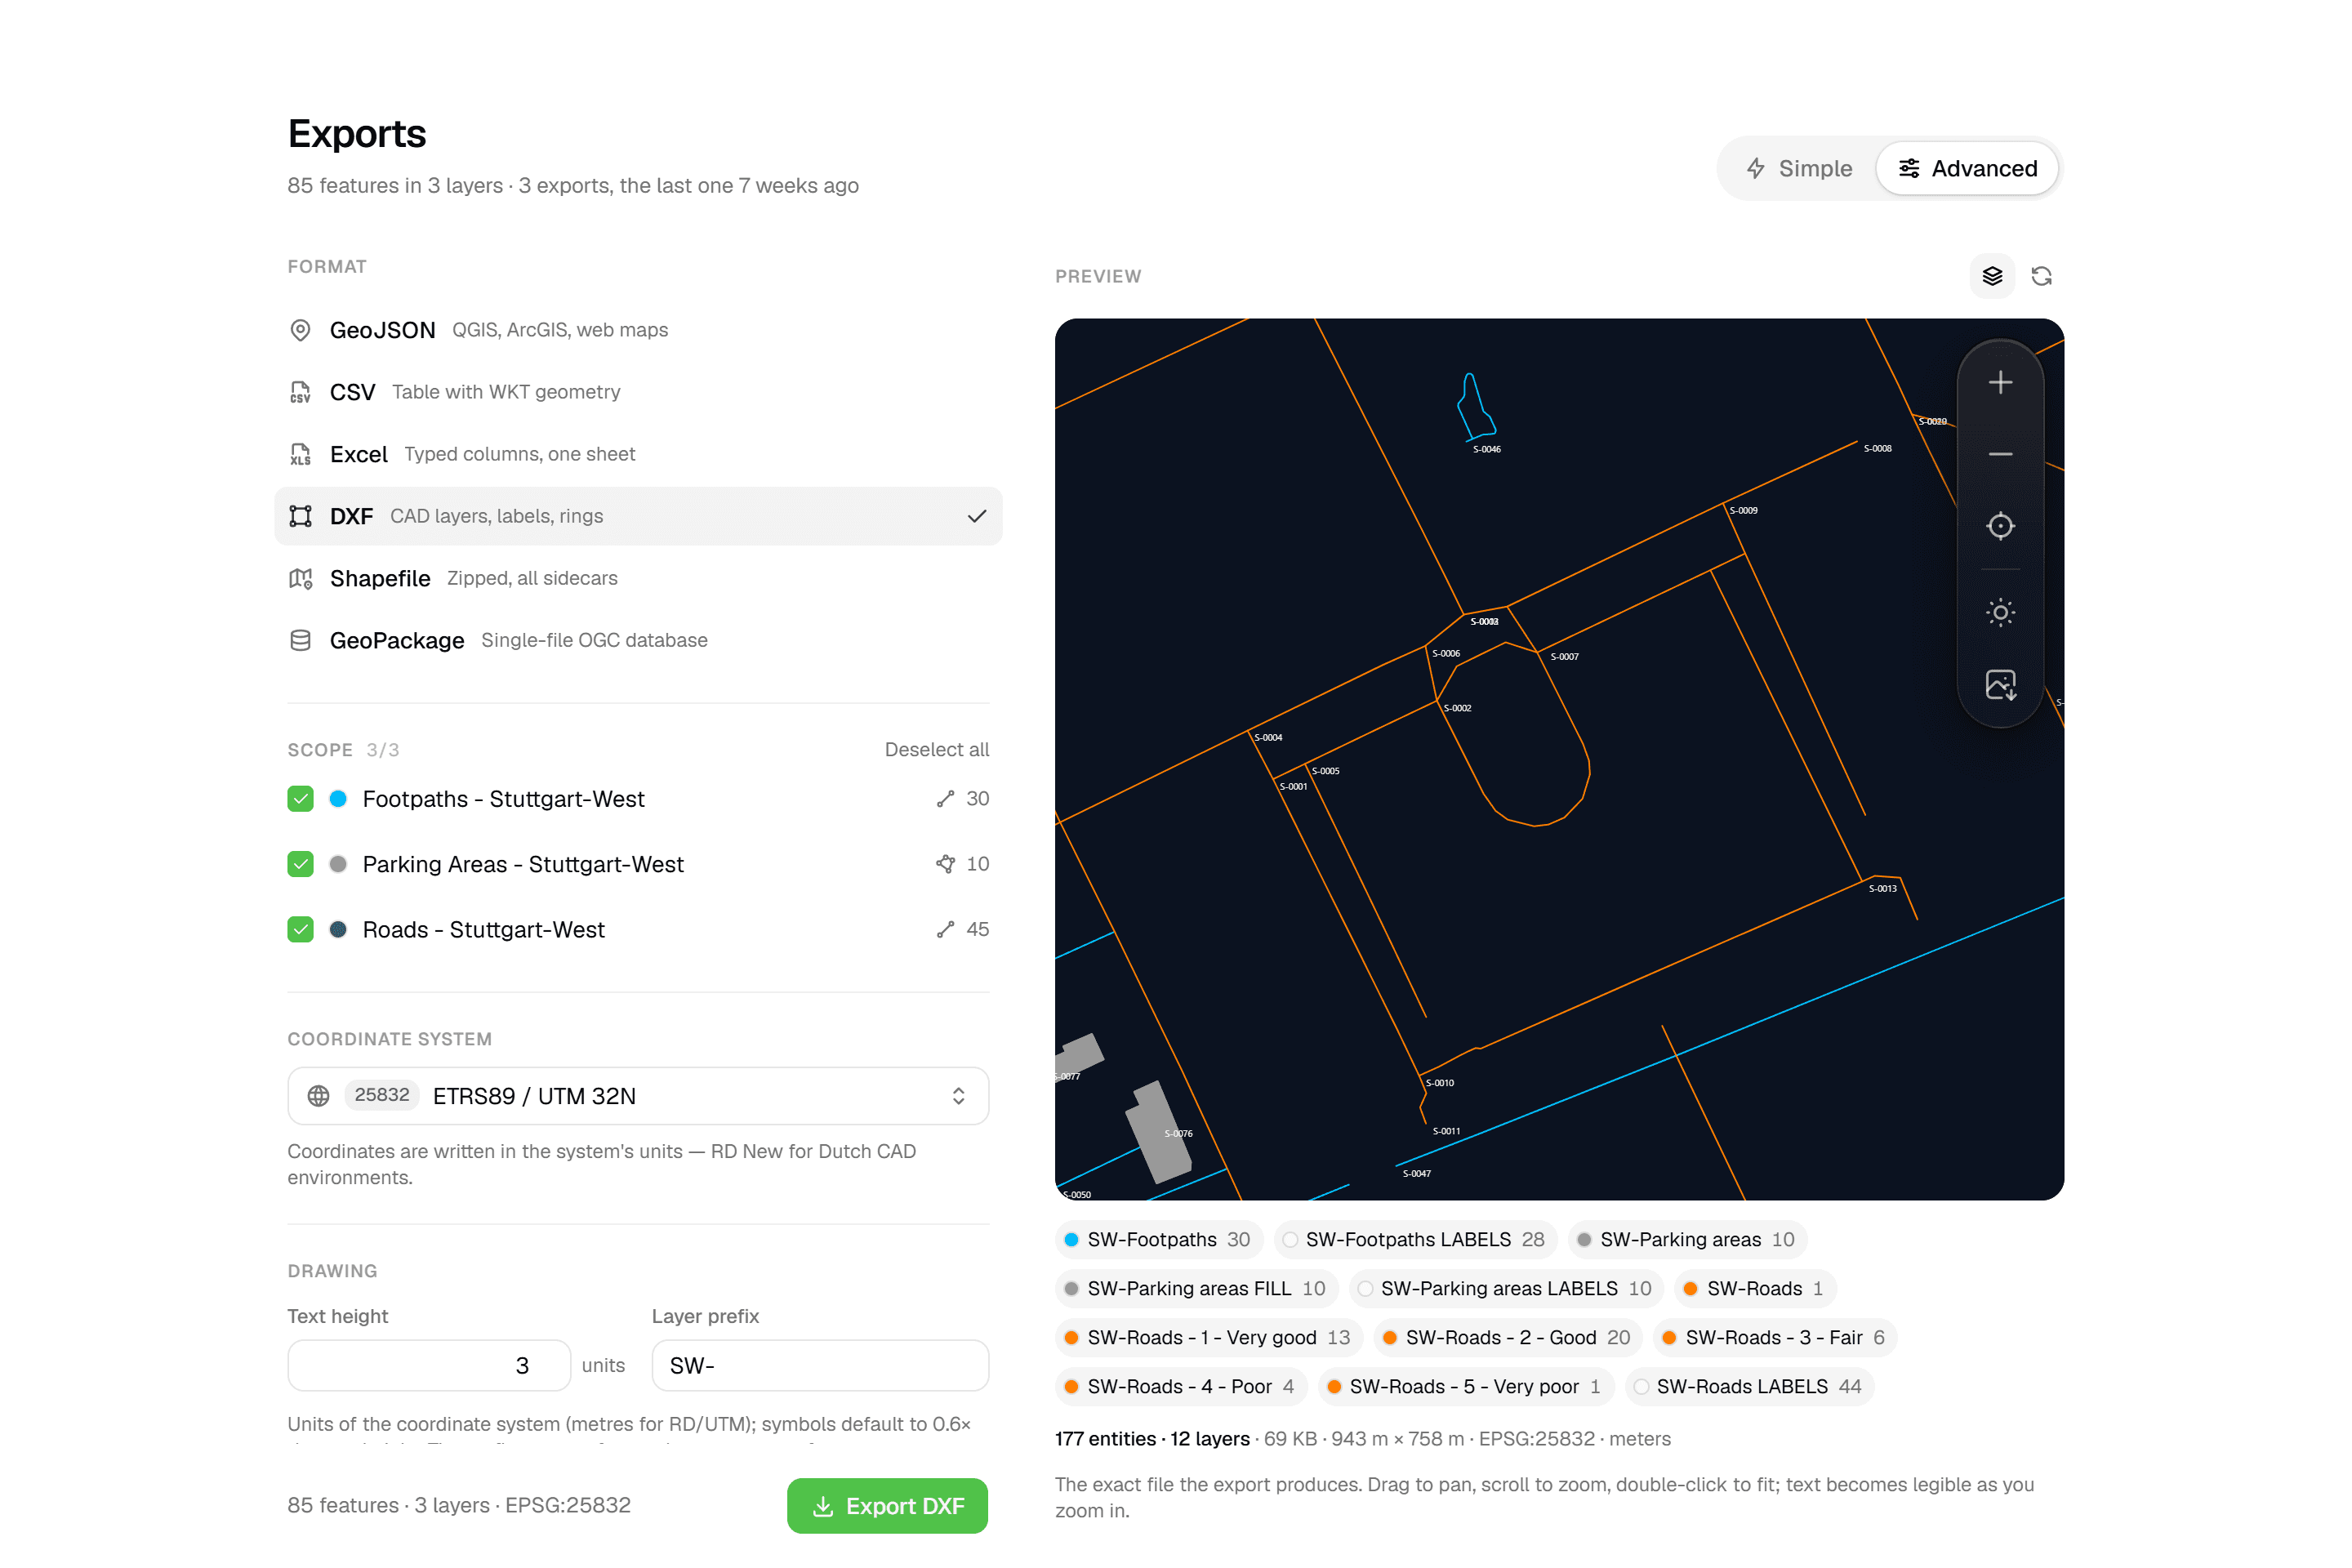 CAD-ready DXF, plus five data formatsLayered DXF with labels, rings and fills, previewed in the browser before you download. GeoJSON, CSV, Excel, Shapefile and GeoPackage on every plan.
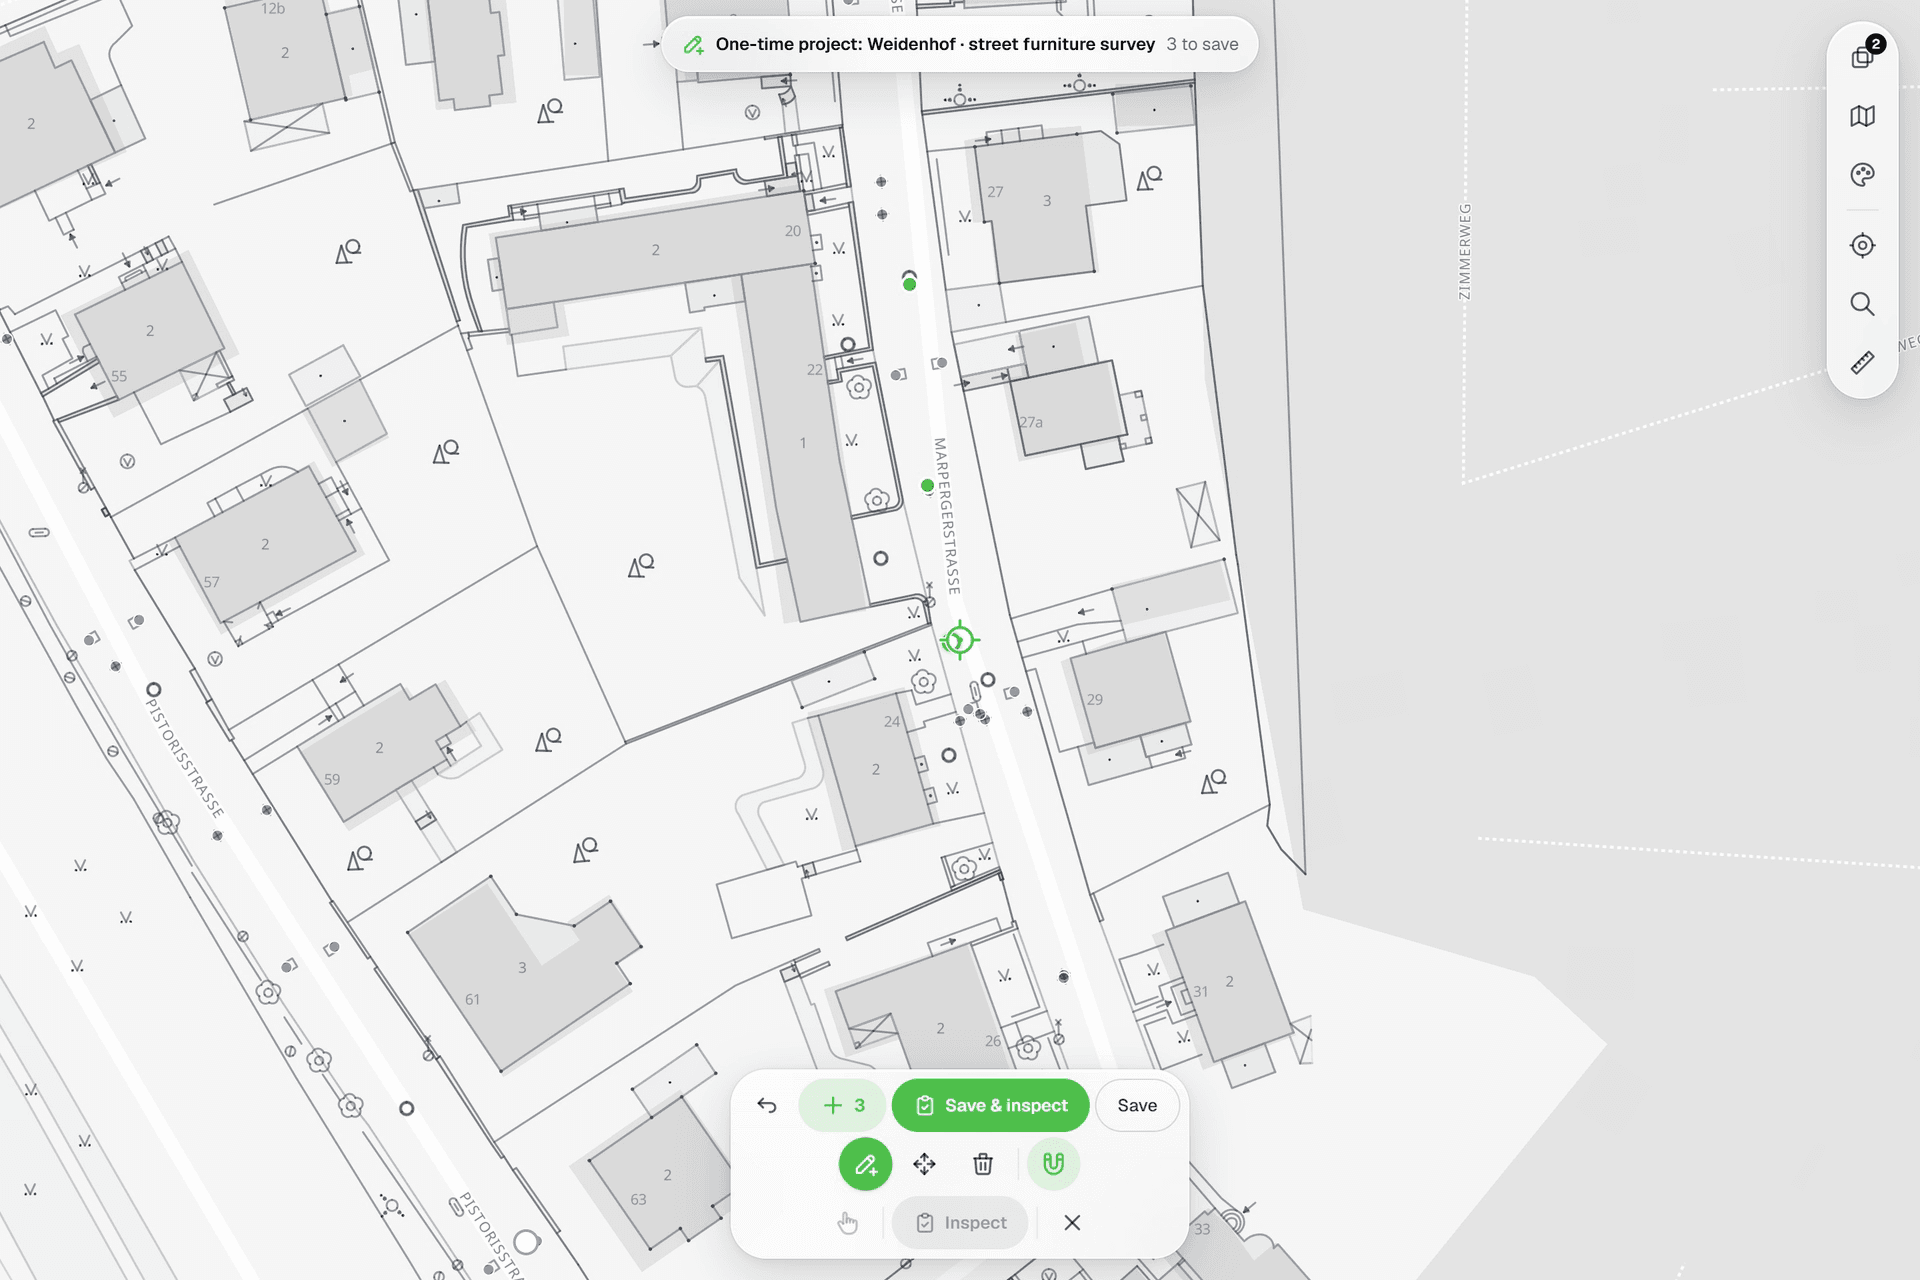 See everything on the mapPoints, lines and polygons over street maps, aerials, BGT and any CAD drawing you upload as reference. Place and correct geometry with a crosshair that snaps to the drawing.
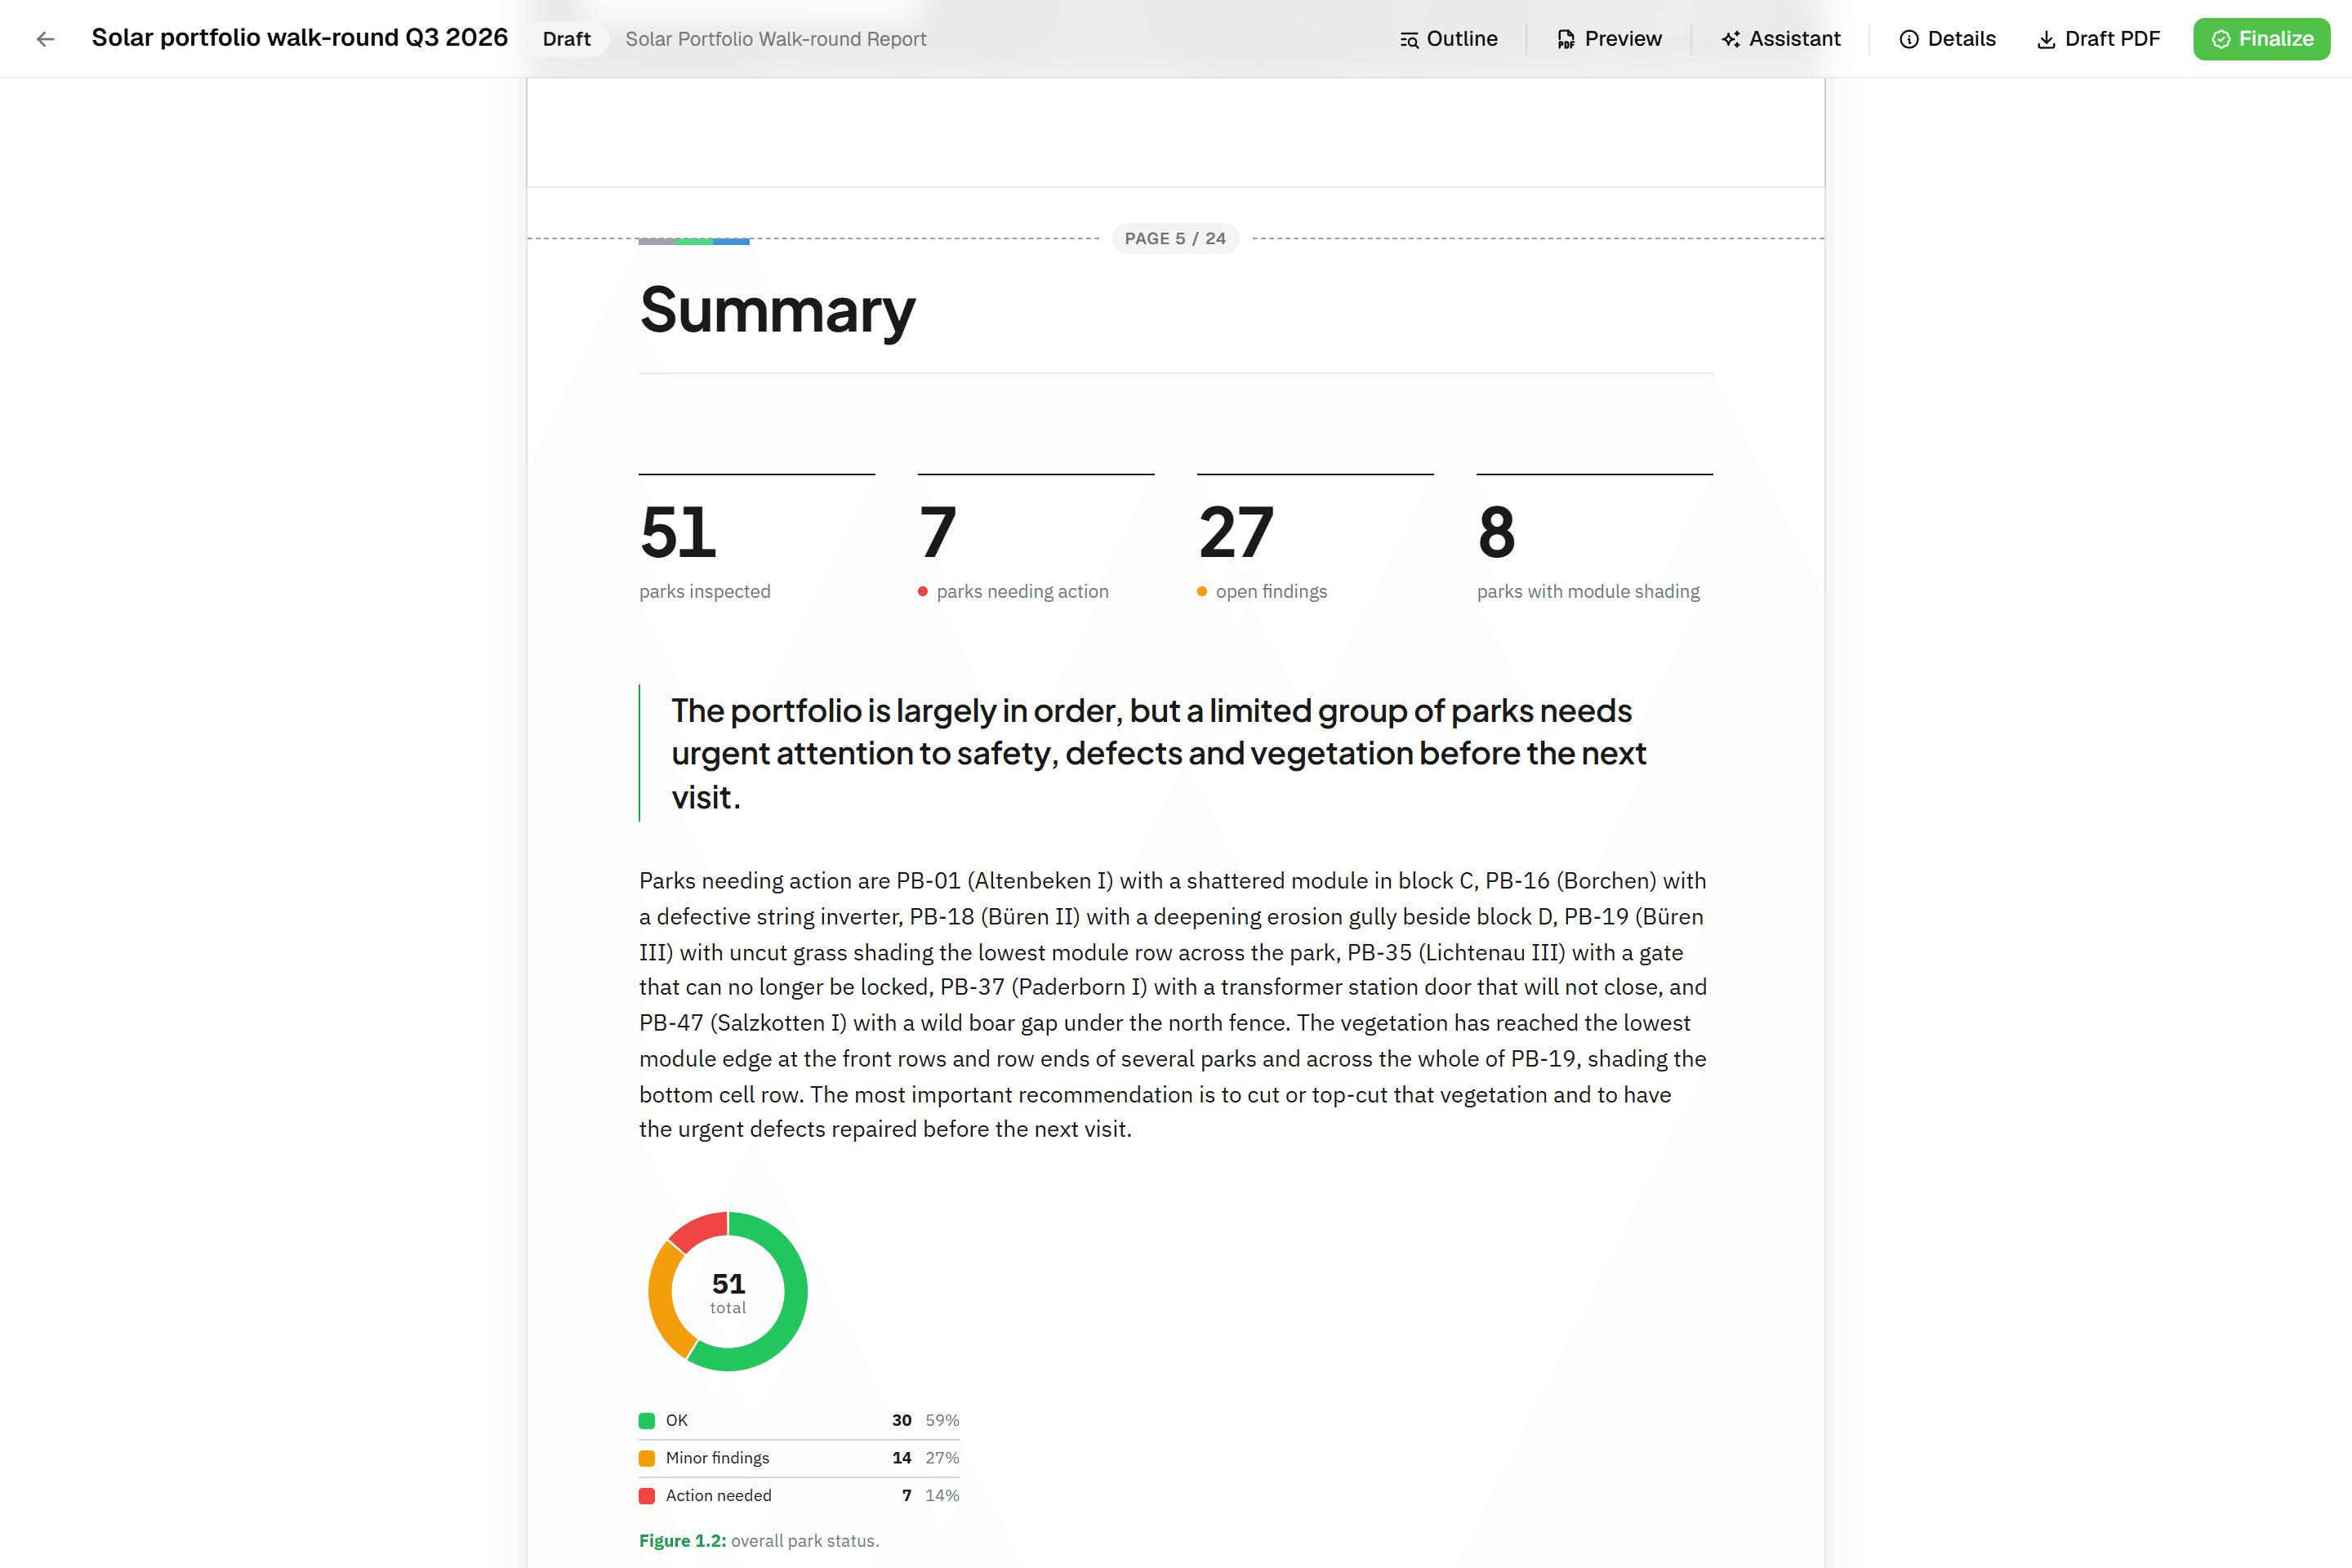 Reports that assemble themselvesBlock-based reports with live data tables, photo appendices, map figures and an AI assistant. Live PDF preview; finalize to an immutable PDF, revise as rev. B.
Try it on your own data
Set up a project and see your own data on the map. Free for 14 days, no credit card.
No credit card requiredFree trial included